
Headwind Measurement in Cycling: How MoguWind Calculates Impact
Wind is not one number for the whole ride. It hits you in sections. Here is how to see the headwind, tailwind and crosswind at every kilometre of your route.
Most cyclists know the wind matters, but few know exactly when they will face it. A 100 km ride is not one long slog into a single wind direction. It is sections. A tailwind for the first 20 km, a headwind for the next 35, a crosswind stretch, then a tailwind again. Measuring the headwind for cycling is not about a single forecast number. It is about knowing how the wind changes across every part of your route. Let's see how to do the "headwind measurement".
Your Strava history does not tell you this. Windy and Ventusky show you a weather map, but not how that wind lands on your route. A general forecast gives one wind value for a whole region, as if every kilometre felt the same. That is not how riding works. You need the wind on your route, at the time you will be there, and how much it will actually slow you down.
A 100 km ride is not one long slog into a single wind. It is sections.
Why Standard Wind Forecasts Fall Short
A general forecast says "12 km/h wind from the north". But what does that mean for a 120 km loop with turns and climbs? The wind hits you differently depending on your heading and the terrain. A north wind is a headwind if you head south, but a crosswind if you head east. And a crosswind is not as punishing as a full headwind. It costs you power, but not all of it.
Elevation changes things too. Higher sections often catch more wind, and a 500 m climb into a headwind is a different story from the same headwind on the flat. Most weather apps treat wind as a single flat value. They do not account for its direction relative to your path, and they certainly do not account for the gradient.
This is where wind data per kilometre changes route planning. Instead of one number for the whole ride, you get the wind at each kilometre, worked out for your heading and your timing.
How MoguWind Works Out the Wind at Every Kilometre
The core idea is simple. MoguWind shows you the wind you will actually face, kilometre by kilometre, at the time you will be riding. Here is what happens behind the scenes.
- Import your route. Upload from Strava or any GPX file to MoguWind Plan. The planner reads every point along your path.
- Work out your heading at each point. For every kilometre it knows which way you are going, north, east or southwest, from the route geometry.
- Match the wind to your heading. Open-Meteo provides the wind speed and direction for your location and time, and MoguWind works out the headwind component, how much of that wind actually opposes you.
- Account for the aerodynamic reality. A 20 km/h headwind costs you more power than a 20 km/h tailwind gives back. MoguWind factors that in. Headwinds hurt more.
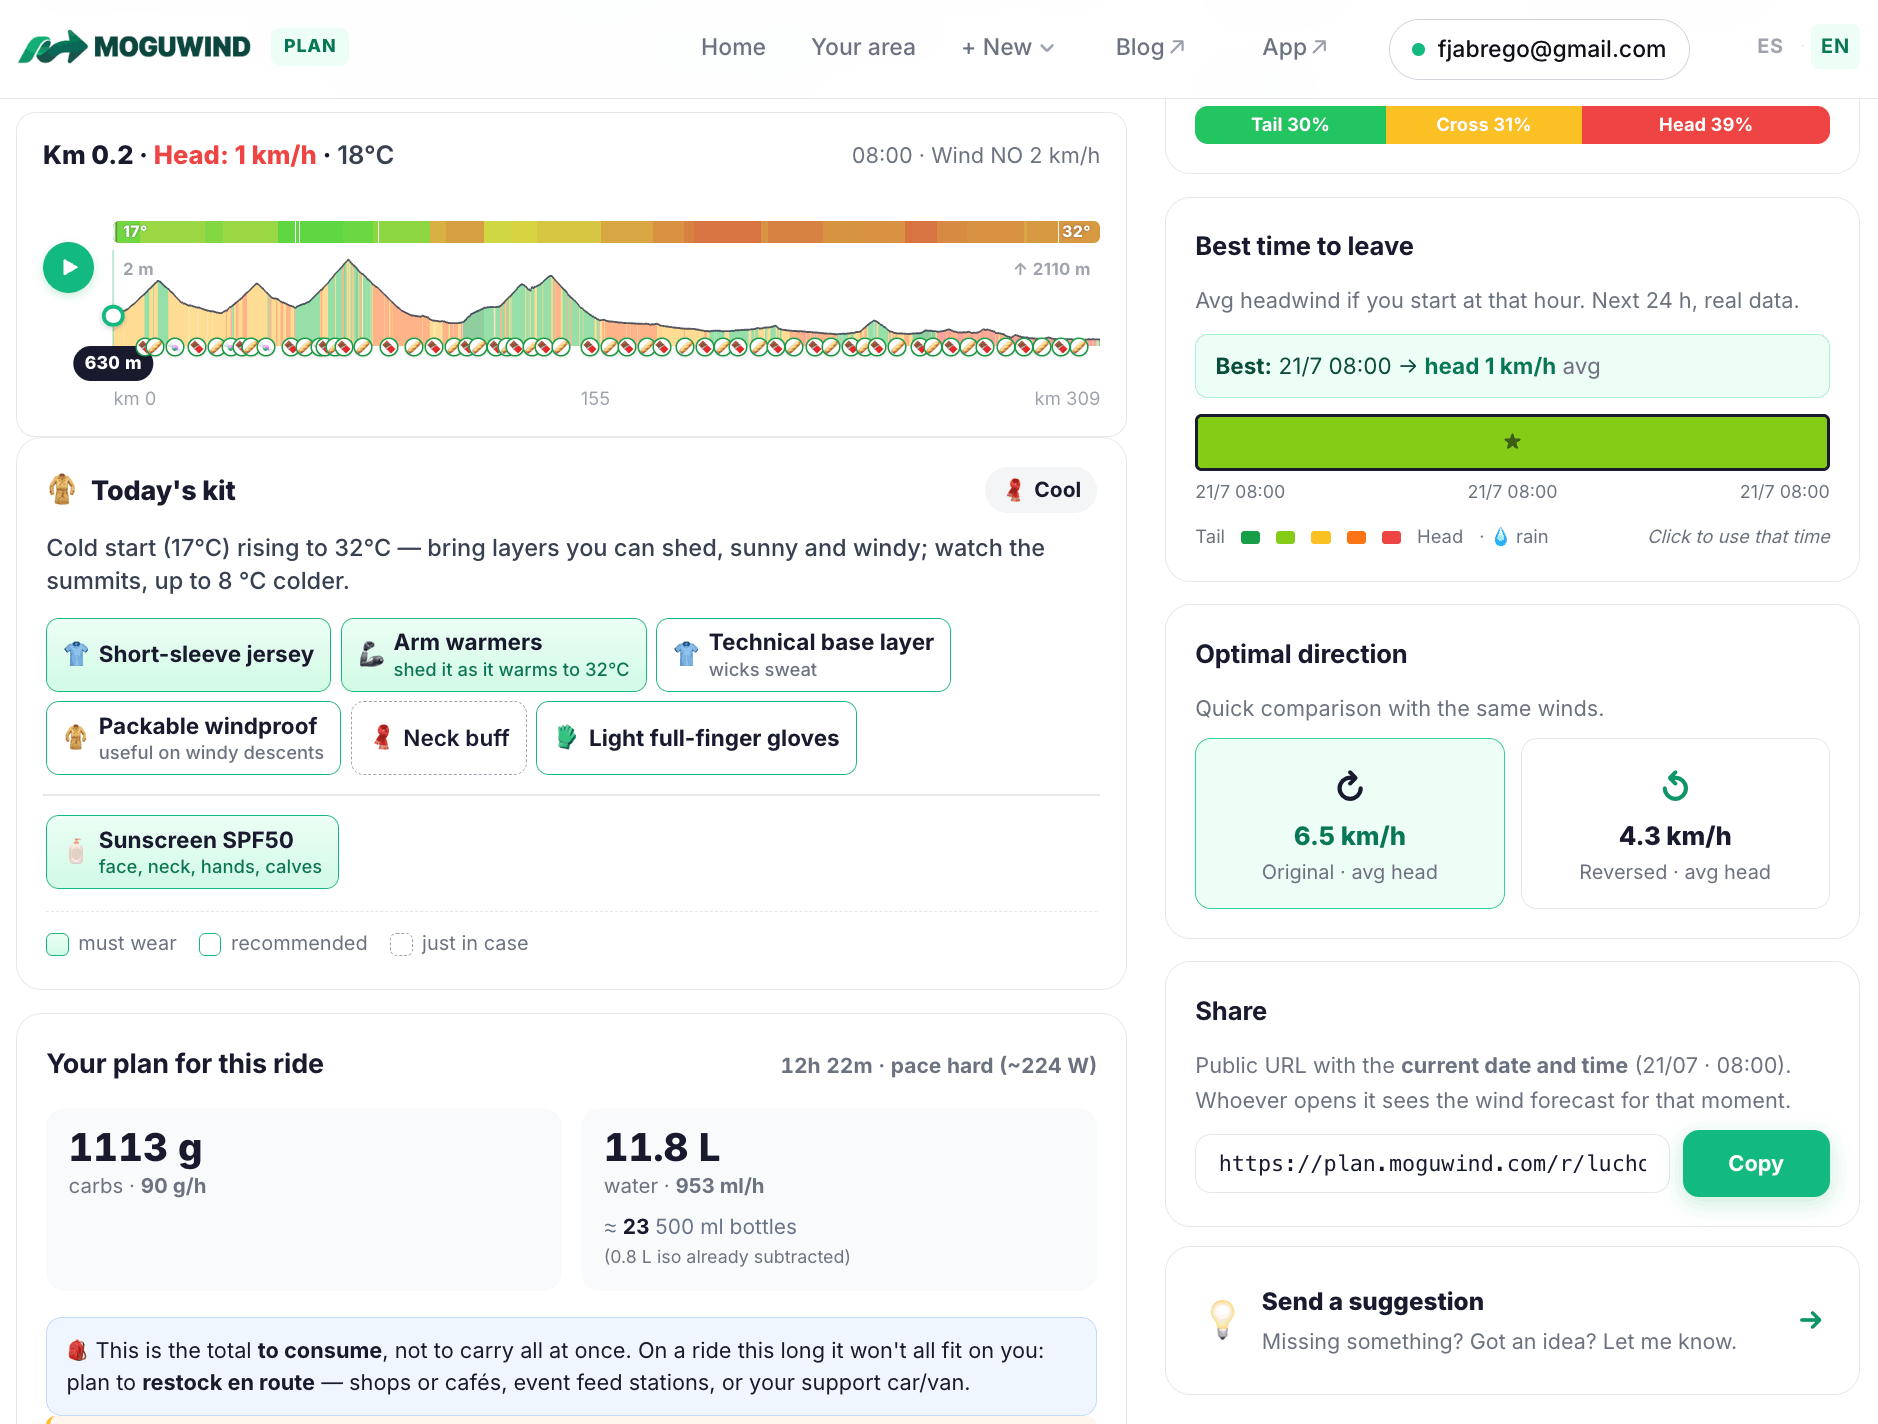
- Show it per kilometre. Instead of "12 km/h wind", you get a colour coded profile with the wind marked at every section.
That is what measuring the headwind looks like in practice. You are not reading a weather map. You are reading your route and seeing exactly where the hard bits are.
You are not interpreting a weather map. You are reading your route.
What You See in the Wind Display
When you plan a route in MoguWind Plan, the wind sits right on your elevation profile, colour coded from tailwind to strong headwind so you can read it at a glance. Green where the wind helps you, through to red where it is really against you.
You can also check the wind speed and direction at any point on the route. And if you plan for a specific time, say Saturday at 8am, the forecast updates to match, because wind shifts with the temperature, the pressure and the hour. MoguWind recalculates all of it. It even shows the time you are likely to gain or lose to the wind, so you know before you tap Start on your Garmin.
Import your route and see the wind at every kilometre before you leave.
Plan your route with MoguWind →Why Kilometre by Kilometre Wind Matters for Strategy
Knowing the wind per kilometre changes how you ride. If you spot a harsh headwind section in the middle of the route, you can pace for it, save energy in the first half and push in the second when the wind helps. If you are climbing into a headwind, you know to fuel harder and ease off the pace.
It is even more useful on long routes, gravel and anything weather dependent. A 160 km gran fondo becomes a different, more tactical ride when you know exactly where the wind wall is. You can also use it to choose between options. Is the scenic route into a headwind worth the extra time, or is the flatter, tailwind option smarter today?
On the day, the MoguWind app for Garmin shows the wind live on your screen. The arrow pointing where the wind is going, the headwind, tailwind and crosswind in km/h, and where the wind will shift over the next hours. You do not have to memorise the forecast. It is right there on the bars as you ride.
See the wind live on your Garmin as you ride.
Get MoguWind for Garmin →The Data Source
MoguWind uses Open-Meteo, a free and global forecast source, refreshed regularly so your data stays current as weather systems move. It is not guesswork. And it is worked out for your route, your location and your time, not a single average for the whole region. That is why it beats a plain "average wind" number.
Real Use, Planning vs Guessing
Before, you might check Windy or a weather app, see "wind from the west" and hope it was not a headwind. Now you load your route and know. You see the wind across every kilometre and you decide on data, not hope.
That is the whole point. Windy tells you what the wind is. MoguWind tells you what wind you will face. Windy shows you a global map. MoguWind shows you your route, and your route is what matters when you clip in.
Windy shows you a global map. MoguWind shows you your route.
Getting Started
Start free at plan.moguwind.com. Import a Strava route, pick a day and time, and the wind appears at once. If you ride a Garmin, download the MoguWind app from Connect IQ. By August 2026 it had passed 10,000 downloads with a 4.7 rating, from riders who want the live wind on their screen.
Wind is a fact of cycling. Guessing about it does not have to be. Measure it, plan for it, and ride smarter.
Keep reading about planning routes with wind.